Strava to FOSS analysis and visualisation
Having used Strava for years I've always been surprised that no one else has made a better alternative.
The UI has been frozen in time, and most of the good features are pay-walled.
I for one refuse to pay for Strava to analyze my data. A better way to sell the subscription would be to make a service so good, so rich, so useful, that I'm begging Strava to take my money.
That being said, Strava is good at activity tracking. Whilst I haven't done any thorough testing, Strava has worked well for me in terms of tracking accuracy.
I also enjoy the interval voice notifications and the multi-sport tracking, cycling especially.
The challenges also, get me outside in mechanical way that I appreciate, whilst cringing that I'm encouraged to go outside by the prospect of money of very expensive kit.
Anyway, where do we go from here...
Until I roll my sleeves and warm up my LLMs to build my own tracking app, I will continue to use Strava.
But I'm planning to own more of my data, and interrogate it locally. And this was the inception moment for the 'Strava to FOSS' project.
The Project
Core features:
- Download activity data from Strava
- Convert data to geospatial data
- Use GeoPandas to explore data
- Use OSMnx to enrich the data with OpenStreetMap nodes
- Use OSMnx and Leaflet to generate custom maps
The project is currently just a series of notebooks on Github, but overtime will be a proper service.
Talking to Strava
The strava_data.ipynb notebook show an example of dealing with the Strava OAuth flow.
I won't go into detail, since the notebook is easy to follow. Do note that the example just gets the first 10 activities.
Once you reached the end of that process you will have an activities.json.
The data
For the sake of our task we need to get the route of the activity, and one way to do this is to use the .map.summary_polyline
[
    {
        "map": {
       	    "id": "a13798432720",
            "summary_polyline": "",
            "resource_state": 2
	},
    }
]
Unclear why, but some activities don't have this entry, whilst other valid entries contain a string.
Also unclear is whether this value will contain elevation data, we have _high and _low elev values within the actitvity. A good mystery to uncover in a future post and feature.
Note that most of the supporting code from this point forward is about the
osm.ipynbnotebook.
Geospatial primer
Geometry
Quick intro to geospatial data is that most things relate to Lines, Polylines, and Polygons.
We normally work with these basic geometric shapes using a low level lib called Shapely.
Whenever we use a geospatial framework, like GeoPanda, they in turn will use Shapely under the hood.
Normally you just get the data in a nice format, but when you're unlocking existing data you will need to implement Shapely for data conversions.
Coordinates
Another important concept with geospatial data is the use of coordinates: latitude, longitude.
You'll see below that in order to make our lives easier we convert original PolyLine data to a geospatial list of coordinates.
I can't stress to you how useful this can be for future analysis.
Take a regular 20km run as geospatial lists: we end up with ~300 coordinate points, we can then compare distances between these, track time across each coordinate point and more.
Formats and GeoInfra
Geospacial data use a JSON flavour called .geojson. You'll see below that there's a big fuss about saving our converted data to .geojson so that we do the format conversion in one step and end up with a portable reusable geospatial file for later geospatial focused tasks.
We can go further and instead of saving to a file, we can save the data to a database like PostGIS. That's not covered here, but stay tuned.
Geospatial data
Back to our Strava data.
- Get the coordinate points
This summary_polyline string is a Google Maps encoded Polyline, a proprietary format.
We will need to decode this using Shapely, because we want the coordinate points.
- Convert them to the right coordinate reference system
We need to understand what cartographic system did they originally use in their encoding. I'll spare you the head scratching, Google Maps uses Mercator system or EPSG:3857.
Best way to imagine the CRS is to imagine yourself in space, floating about. Now imagine that your friend is also there with you, floating around like a maniac. Great! Now I ask that both you and your friend look down at the Eifel tower, manifique!
You and your friend will be looking at the same coordinate (lat,lng), but you each have a different angle to that coordinate. As such you each have your or CRS.
We do this crs conversion via GeoPandas.
- Working with GeoPandas
When we use GeoPandas we need to also deal with how it expects coordinates. By default GeoPandas expects a crs called WGS84 or EPSG:4326.
When we load the data from the original Polyline conversion we need to load it as WGS84 and then change the crs to Mercator.
But we're not done quite yet. You see that WGS84 crs is very important for geographic operations inside GeoPandas. Mapping, distance, comparisons are all done in the WGS84 crs.
Before we start doing these geographic operations we need to make sure that we convert back from Mercator to WGS84.
What happens if we load the data as WSG84?
Try it and see (once you set up the mapping of the data).
If you want to take my word for it, the positions are inaccurate. If you have a clear start and end point they will be shifted by a few meters.
- Correct format for lat,lng
Each mapping technology will have their own system, Folium for example requires (lat, lng). The normal format.
Others require the 'goofy' format (lng, lat), looking at you GeoPandas and Google Maps. There may be a valid reason, but that is smaller that my ignorance atm.
For the record when geospatial data is inside GeoPandas it's usually (lng, lat), so remember to do a switch before you try to map the data.
What happens if you don't?
Northwest England coordinates, get mapped in the Bay of Mogadishu, Somalia. I guess you'd call it the other side of the world somehow.
- Polygons
This is where we leverage some of these coordinates to draw a shape around them.
Using these Polygons we can then make filters for calls to other geospatial services like OpenStreetMaps
OpenStreetMaps
Still very much a black hole for me, but at the core we want to map our coordinates line to an OpenStreetMap map.
We could be naive and just get the whole map, but that's a huge amount of data.
Instead we use our coordinates to create a polygon, and we filter the OSM data with that polygon. This is where depending on the situation you might have to add borders to your polygon.
Worth noting that this step is incredible fiddly because all OSMnx requests are made via a limited open-source api. Even if it weren't limit, hammering the api would be akin to kicking puppies. Don't do it!
The adjustment of the polygon thus makes sure that we only query what is necessary.
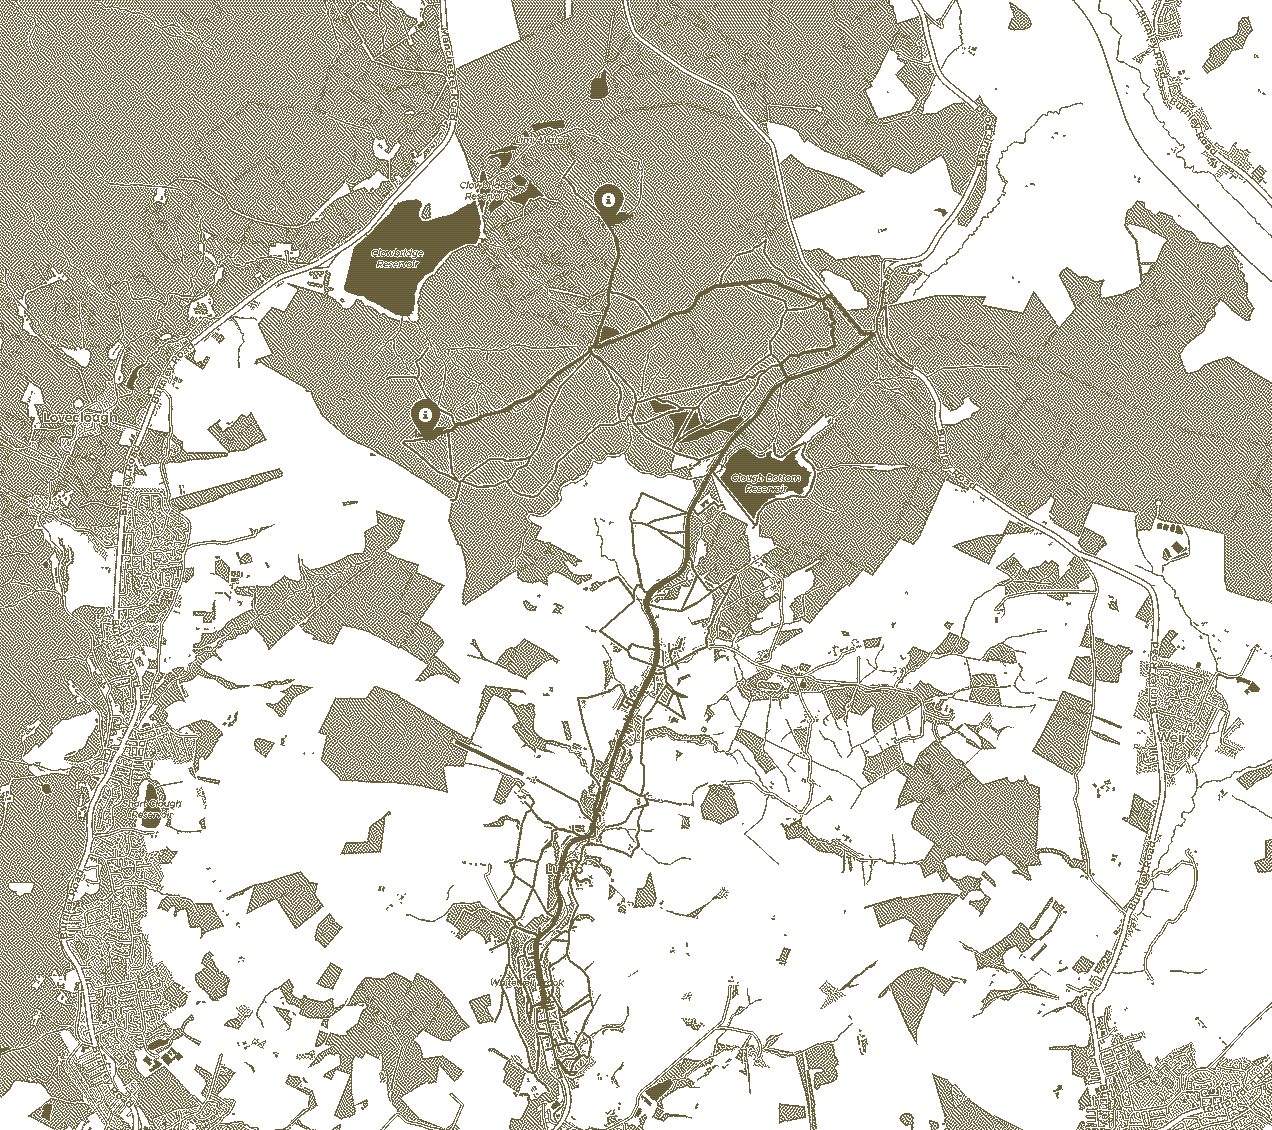
What we get from these queries is the graph.
In order to tell OSM what to put in the graph we can specify the network types: road, walk, cycling etc. As well as other filters.
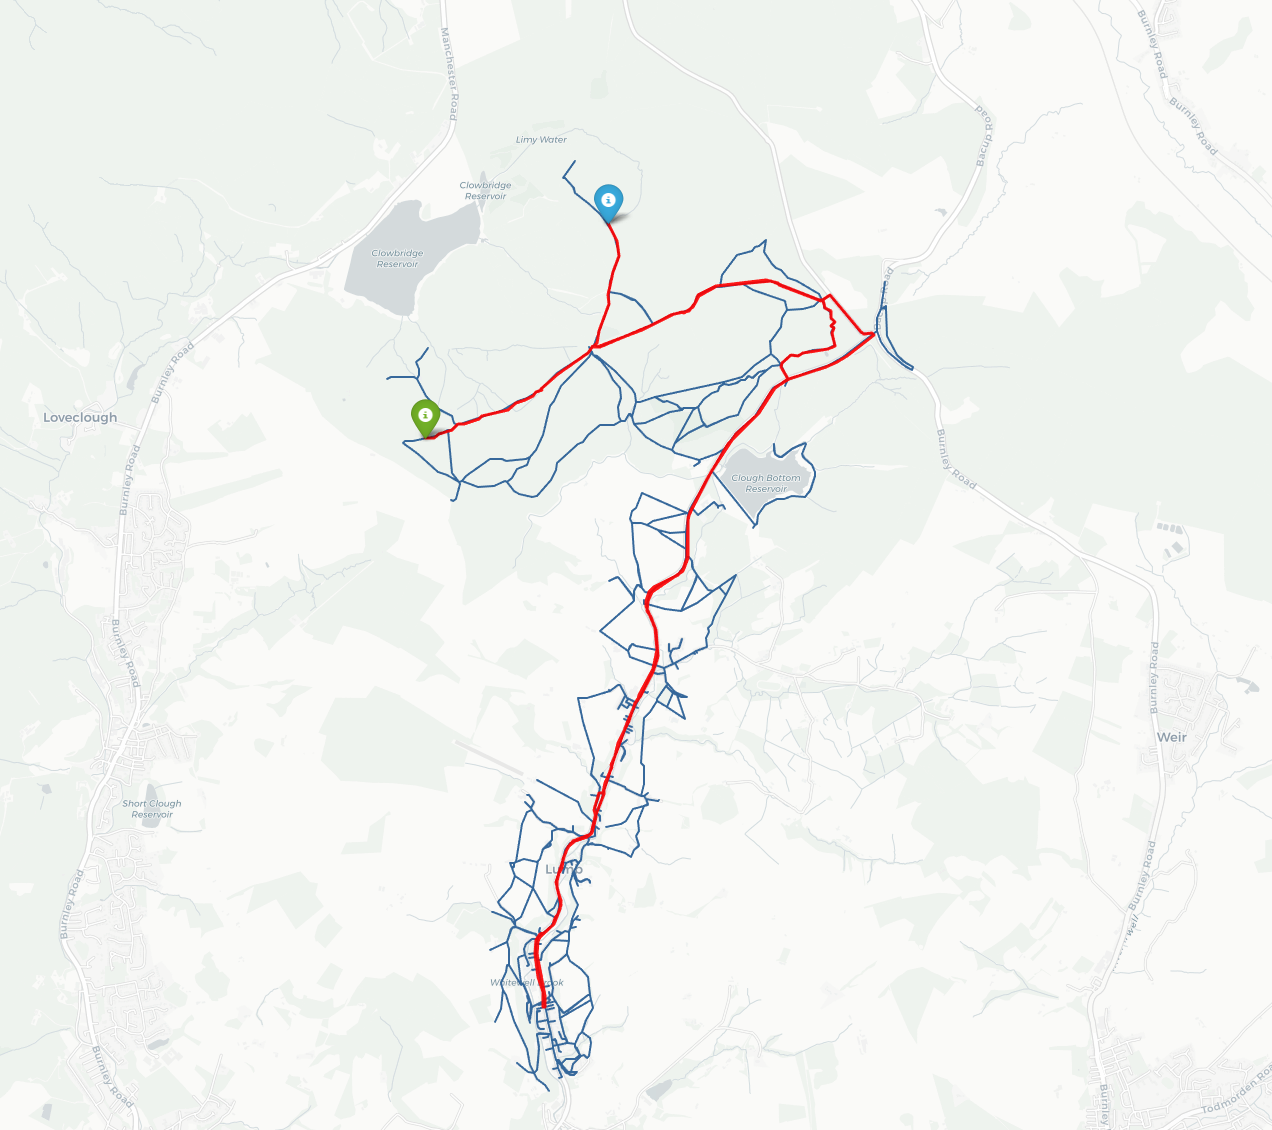
Mapping with Folium
Just a remind we're aiming to map the Strava activity onto an OpenStreetMap graph of nodes.
Folium will:
- take the route DataFrame, and the OSM graph
- use the route to define the center of the map
- use the graph to define the edges of the map
- then plot the route as a
folium.PolyLine() - then plot the route start and end as
folium.Marker()
Pulling it together
In conclusion, to free our Strava data we need to:
- Read the Google Maps polyline data and convert to (lat,lng)
- Remap that coordinate line to the correct CRS and regular or goofy (lat, lng) pairs
- Create a polygon from the coordinates
- Use the polygon to extract data from OpenStreetMap into a graph
- Generate a map from the coordinates and the graph
As a final touch we output the map to an html file, which you can see here
Conclusion
This is just scratching the surface of what is possible, and I strongly recommend you give it a try.
For the next iteration, I'll be fetching all my Strava data, converting it to geospatial, and save it inside a database.
Final result